Data governance defines who is accountable for each data asset, what it means, how reliable it is, and who may use it. Three capabilities bring those agreements into operations: the data catalog, lineage, and data quality.
Pillar 1 — The data catalog: a search engine for your data
Think of how many times you have seen this conversation in a company chat: "does anyone know where the good churn table is?". Three people reply with three different tables. One is deprecated, another is an experiment by someone who already left, and the third one… might be the right one. Nobody is sure.
A data catalog solves exactly that: it is the searchable inventory of all the data assets in the organization — tables, dashboards, pipelines, models — with their context: what each one contains, who owns it, what its columns mean, how fresh it is, and which tags it carries (for example, whether it contains personal data).
$ search "churn"

1. analytics.fact_churn_monthly      [certified]
   owner: Analytics Team | updated: today
   "Official monthly churn. Source of the executive dashboard."

2. sandbox.churn_test_v2_OLD         [deprecated]
   owner: (unassigned) | updated: 14 months ago
The difference between guessing and knowing: the catalog tells you which table is official, who owns it, and whether it is alive.
The analogy we use the most: the catalog is the internal Google of your data. Without it, finding information depends on who you know and how long you have been at the company — pure tribal knowledge. With it, any newcomer finds in minutes what used to take weeks of asking around.
Pillar 2 — Lineage: the dependency map
Lineage answers two questions: where does this data come from? and what breaks if I touch it? It is the map showing how data flows from source systems to the final dashboard, through every intermediate transformation.
Back to the example from the previous article: the report that wakes up broken on a Monday. The full story usually goes like this: on Friday, the CRM team renamed the customer_type column to segment. A minor change, they thought. But that column fed a staging table, which fed the master customer table, which fed the executive dashboard:
crm.customers (column renamed Friday 18:40)
  └─> staging.stg_customers      [x] pipeline failed
       └─> marts.dim_customers   [x] not refreshed
            └─> "Executive KPIs" [x] empty dashboard on Monday
Lineage: the dependency chain nobody sees… until it breaks.
With lineage, this story changes at two moments. Before the change: the CRM team checks the map, sees that 3 pipelines and 12 dashboards depend on that column, and gives a heads-up (or decides not to rename it). After a failure: instead of three hours of SQL archaeology to find the root cause, the map shows in seconds where the problem started and what was affected downstream.
Lineage also has a less dramatic and more valuable use: trust. When an executive asks "where does this number come from?", being able to show the full path — which system it comes from, which transformations it went through — turns an argument of faith into an engineering conversation.
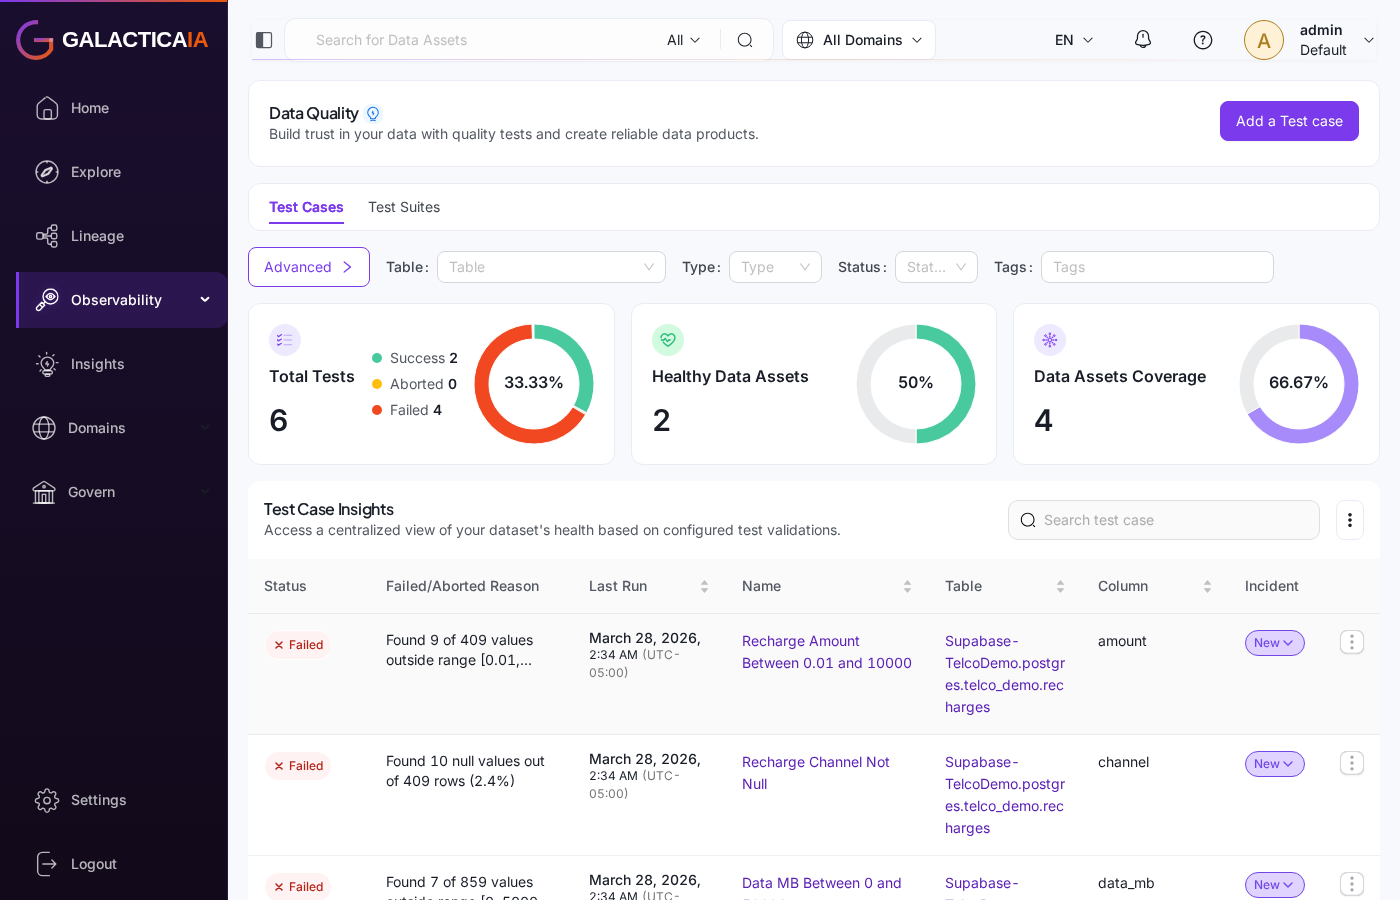
Pillar 3 — Data quality: tests for your data
In software engineering, nobody ships important code without tests. In data, curiously, the opposite was normal for years: pipelines moving millions of rows to production without a single validation. Data quality applies the same testing discipline to the data itself.
The classic dimensions, in plain language:
- Freshness. Did today's data arrive? A perfect table with three-day-old data can be worse than none, because nobody notices it is stale.
- Completeness. Are all the expected rows and values there? If
customer_idhas 4% nulls since yesterday, something broke upstream. - Uniqueness. Are there duplicates? The classic: a botched backfill duplicates rows and suddenly monthly revenue "grew" 30%. The celebration lasts until someone double-checks.
- Validity. Do the values make sense? Birth dates in the future, negative amounts where they do not apply, country codes that do not exist.
The key point is that these validations run automatically and continuously, like software tests in a continuous integration pipeline. The goal is for the data team to detect problems before they affect a decision. The tooling may be cloud-native, open source, or tailored; the deliverable is an operating control with an owner.
The three pillars reinforce each other
Separately, each pillar helps. Together, they change the nature of the system:
- The catalog tells you what exists, what it means, and who owns it.
- Lineage tells you where it comes from and what it impacts.
- Quality tells you whether you can trust it right now.
The combination is what makes it powerful: you find the table in the catalog, see in its lineage that it feeds the executive dashboard, and check that its quality tests are green — all in the same place. That combination has a name: trust. And when test results and change notifications flow to the owners you defined in the catalog, the loop closes: problems get detected, routed, and solved without heroics.
Catalog, lineage, and quality are not three separate projects: they are three faces of the same question — can I trust this data?
These capabilities may be implemented in an integrated platform or composed on the existing stack. The technology choice follows the architecture, controls, and operating model the case requires.
If you need to design these capabilities or connect their controls with a business decision, tell us about your case. You can also review our Data Strategy & Governance practice.